Archive for Information / Mapping

If These Wheels Could Talk


If These Wheels Could Talk

If These Wheels Could Talk book; 34 x 6.5in. (spread), 116ppg. / 2004

Soon after the dot-com and 9/11 crashes, my design job also crashed. I set about looking for another, through other firms, recruiters, friends, friends of friends, and so on. All unable to take on the frivolous weight of an underdeveloped type and image manipulator, I broadened my search criteria: assistant… receptionist… data enterer… Anything that would have me back in the office environs to which I had grown so entitled. But there was nothing to be had. Facing the loss of everything, the idealization of pre-crash innocence struck me. I printed out a few standard government forms, borrowed a friend’s car and found myself driving southward to the King County Metro headquarters. I was on my way to becoming a bus driver.

Public transportation is one of the great noble causes of our time, and the bus embodies the struggle most colossally: angling through bourgeois car traffic to transport the proletariat affordably to their destination. Having grown up without a car, I had developed a keen appreciation for the bus’s role, and, as the false hopes of cubicle walls crumbled, to give my hands to one of their great helms all of a sudden seemed right. But, for all my idealization, I also knew the motley reality of what goes on above the turning wheels: The bus riding masses are an odd bunch, particularly in a city where almost everyone who can drives a car instead… Read the rest of this entry »

Filed under Content / Architecture, Copy / Writing, Information / Mapping, Naming / Words, Photography / Film, Print / Editorial

Comments


What Happenned?!!


Election 2000 introductory screen; Flash interactive interface; 1024 x 768px. / 2004

All U.S. citizens are deeply affected—for better or worse—by the president in office. However, very few people know the intricacies of the presidential election process. This is not surprising, as it is super freakin’ complicated. The problem is that most are too jaded to care, even when their country is on the line.

For Interaction Design, one of the Senior year courses in the University of Washington Visual Communication Design program, we were given the task to explain the unexplainable to your average ignorant know-it-all who doesn’t want to be explained to. The aim of this project was to create an interactive interface to help inform the average high-school or university student about the United States presidential election process. As with several classes before, the project was divided into two distinct phases: In the first, we worked in groups to research the process and the various forces involved and brainstormed different interpretations thereof. In the second phase, we set off individually to define and create interactive Flash-based demonstrations of our particular concepts.

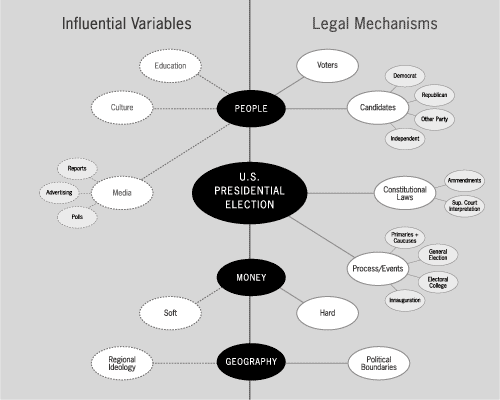
I had the good fortune of having three brilliant brains with whom to storm in phase one: Stephanie Cooper, Luke Jung and Tim Turner. As part of our comprehensive research process, we developed various interpretations of how the presidential election could be understood. We first set out to describe the components, both legal and otherwise influential…
[roll over images to enlarge]

U.S. presidential election variables, influential and legal; digital output; 11 x 8.5in. / 2004

We then divided the country (as elections do so well) to figure out how the importance of different factors were distributed geographically… Read the rest of this entry »

Filed under Content / Architecture, Copy / Writing, Information / Mapping, Interactive / Web, Naming / Words

Comments


A Killer Project

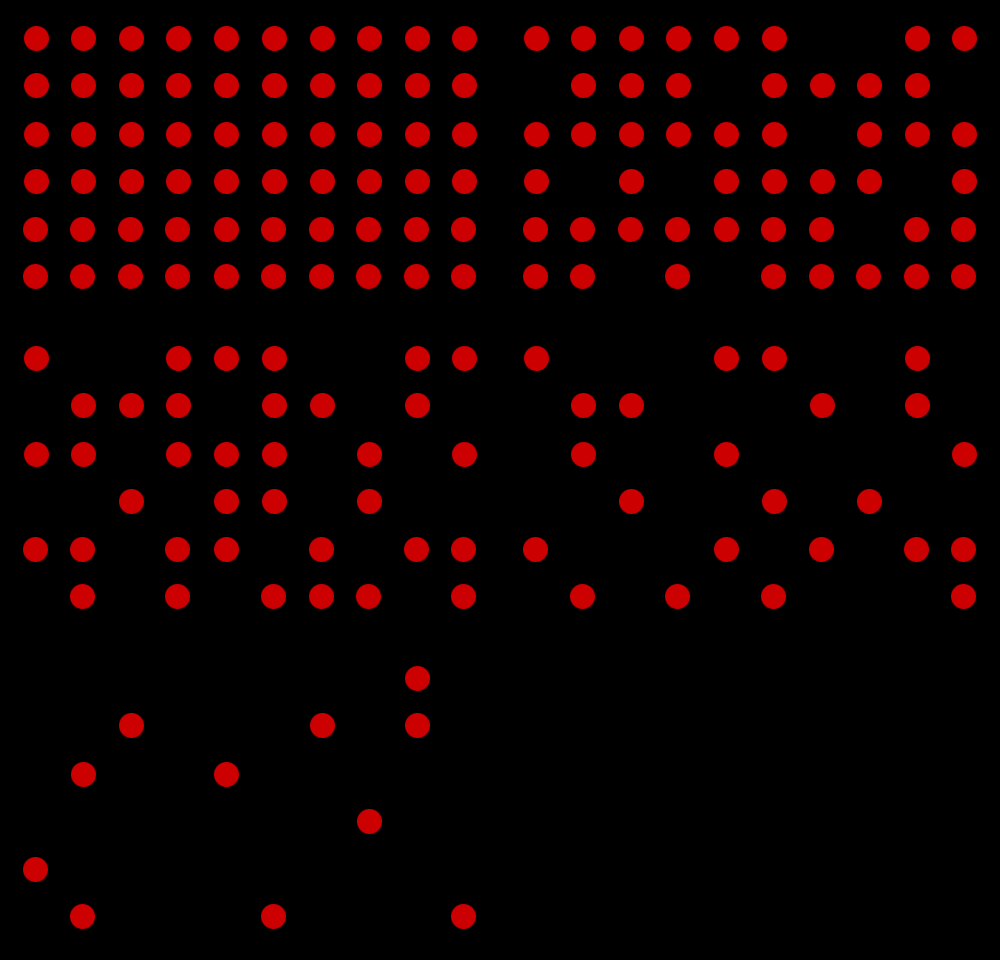
lives being lost to Cardiovascular Disease (shown in real time; multiply by 25,000 for annual number) animated illustration for presentation; source: 2000 U.S. Census; originally 10 x 7ft. (projected) / 2004

Data is boring. It’s just facts and figures; numbers on a page. There’s no life in it: No blood, sweat or tears, not to mention sex. But actually, there almost always is. Nearly all data is merely classified results of the choices people make. If someone didn’t make enough money to pay their phone bill. If someone trained hard enough to win an Olympic bronze medal. If someone was found 30 stories below a penthouse balcony. There is data that can tell us all about these things. Unfortunately, it’s too often left flat, or worse, twisted up in knots, suffocated and sputtering in it’s own purple ink. It is in the mindful extrication, marrying and expression of data that its ones and zeroes may come to life, breathe in our faces and tell us to pay attention for a minute because it’s going to help us understand the beautiful and the terrifying things we’ve done. This is information design.

Nothing should teach us more about ourselves than adversity, and that’s what we were faced with in Information Design, one of the most sweat-worthy courses in the decidedly rigorous Visual Communication Design program at the University of Washington. Indeed, the subjects of our designs were nothing short of catastrophic: groups were assigned strains of natural disasters or epidemics to seek out, research and present based on their potential merit to inform through design. After this, we were to design at least three magazine spreads of narrated information graphics individually.

Our research team, comprised of Jesse Graupmann, Jim Nesbitt and myself came upon Cardiovascular Disease (CVD), by far the United States’ most prolific killer. In terms of deaths and monetary expenditures, raw data makes it clear that CVD, which encompasses Heart Attack, Stroke, and various other arterial conditions, is a significantly larger problem than any other known phenomenon.

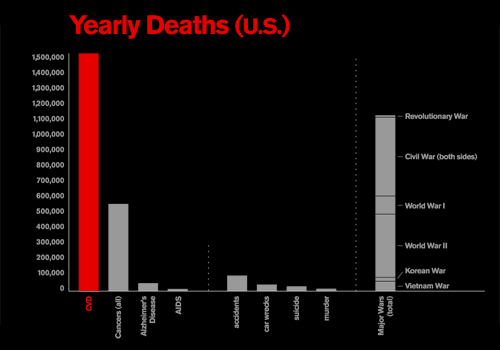
comparison of annual deaths between Cardiovascular Disease, Cancer, Alzheimer's Disease and AIDS, as well as annual deaths by accident, automobile collisions, suicide and murder, and the total deaths accrued in all significant U.S. wars

comparison of annual deaths between Cardiovascular Disease, and other notable causes of death, as well as the total deaths accrued in all significant U.S. wars; (roll over to enlarge) [sources: American Heart Association, 2003; Centers for Disease Control 2003; U.S. Pentagon, 2000]; originally 10 x 7ft. (projected) / 2004

Currently, on average, CVD kills about 1.5 million people per year in the U.S. or one every 33 seconds, accounting for 39.4% or one of every 2.5 deaths in the year 2000. Even all forms of cancer combined don’t kill as many people as does Coronary Heart Disease alone, just one of several types of Cardiovascular Disease. This is not to mention non-disease related deaths such as murders or accidents, which also pale in comparison to CVD. Perhaps most shocking is that more people die of Cardiovascular Disease each year than were killed in every major U.S. war, combined.

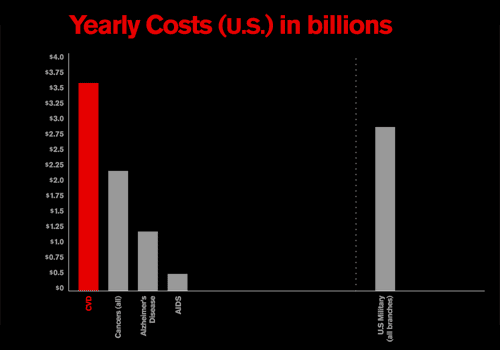
comparison of annual costs between Cardiovascular Disease, Cancer, Alzheimer's Disease and AIDS, as well the combined annual budget for the U.S. military

comparison of annual costs between Cardiovascular Disease, Cancer, Alzheimer’s Disease and AIDS, as well the combined annual budget for the U.S. military (roll over to enlarge) [sources: American Heart Association, 2003; Centers for Disease Control 2003; U.S. Pentagon, 2000]; originally 10 x 7ft. (projected) / 2004

In our presentation to the class, we introduced these and other such daunting facts with the animated chart at the top of this post projected behind us, illustrating deaths occurring due to the disease even as we were making the presentation. We made a pretty good case, and we were off on our own to dive in and make those facts dance their deadly dance in the pages of our own magazine articles.

But having the undisputed king of killers wasn’t enough for me. I was thirsty for more blood. I suppose I wanted more sex in it, too. Based the numbers above, Cardiovascular Disease sounds pretty bad, but how could it be worse than HIV and AIDS? I set out to answer this question by comparing the two based on five critical factors… Read the rest of this entry »

Filed under Content / Architecture, Copy / Writing, Drawing / Illustration, Information / Mapping, Print / Editorial

Comments