Archive for Drawing / Illustration

A Killer Project

lives being lost to Cardiovascular Disease (shown in real time; multiply by 25,000 for annual number) animated illustration for presentation; source: 2000 U.S. Census; originally 10 x 7ft. (projected) / 2004

Data is boring. It’s just facts and figures; numbers on a page. There’s no life in it: No blood, sweat or tears, not to mention sex. But actually, there almost always is. Nearly all data is merely classified results of the choices people make. If someone didn’t make enough money to pay their phone bill. If someone trained hard enough to win an Olympic bronze medal. If someone was found 30 stories below a penthouse balcony. There is data that can tell us all about these things. Unfortunately, it’s too often left flat, or worse, twisted up in knots, suffocated and sputtering in it’s own purple ink. It is in the mindful extrication, marrying and expression of data that its ones and zeroes may come to life, breathe in our faces and tell us to pay attention for a minute because it’s going to help us understand the beautiful and the terrifying things we’ve done. This is information design.

Nothing should teach us more about ourselves than adversity, and that’s what we were faced with in Information Design, one of the most sweat-worthy courses in the decidedly rigorous Visual Communication Design program at the University of Washington. Indeed, the subjects of our designs were nothing short of catastrophic: groups were assigned strains of natural disasters or epidemics to seek out, research and present based on their potential merit to inform through design. After this, we were to design at least three magazine spreads of narrated information graphics individually.

Our research team, comprised of Jesse Graupmann, Jim Nesbitt and myself came upon Cardiovascular Disease (CVD), by far the United States’ most prolific killer. In terms of deaths and monetary expenditures, raw data makes it clear that CVD, which encompasses Heart Attack, Stroke, and various other arterial conditions, is a significantly larger problem than any other known phenomenon.

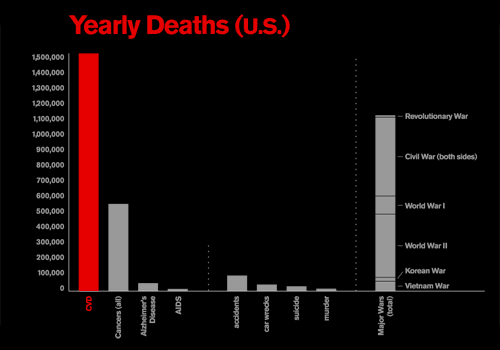
comparison of annual deaths between Cardiovascular Disease, Cancer, Alzheimer's Disease and AIDS, as well as annual deaths by accident, automobile collisions, suicide and murder, and the total deaths accrued in all significant U.S. wars

comparison of annual deaths between Cardiovascular Disease, and other notable causes of death, as well as the total deaths accrued in all significant U.S. wars; (roll over to enlarge) [sources: American Heart Association, 2003; Centers for Disease Control 2003; U.S. Pentagon, 2000]; originally 10 x 7ft. (projected) / 2004

Currently, on average, CVD kills about 1.5 million people per year in the U.S. or one every 33 seconds, accounting for 39.4% or one of every 2.5 deaths in the year 2000. Even all forms of cancer combined don’t kill as many people as does Coronary Heart Disease alone, just one of several types of Cardiovascular Disease. This is not to mention non-disease related deaths such as murders or accidents, which also pale in comparison to CVD. Perhaps most shocking is that more people die of Cardiovascular Disease each year than were killed in every major U.S. war, combined.

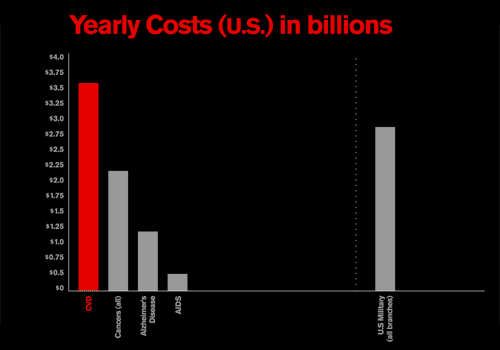
comparison of annual costs between Cardiovascular Disease, Cancer, Alzheimer's Disease and AIDS, as well the combined annual budget for the U.S. military

comparison of annual costs between Cardiovascular Disease, Cancer, Alzheimer’s Disease and AIDS, as well the combined annual budget for the U.S. military (roll over to enlarge) [sources: American Heart Association, 2003; Centers for Disease Control 2003; U.S. Pentagon, 2000]; originally 10 x 7ft. (projected) / 2004

In our presentation to the class, we introduced these and other such daunting facts with the animated chart at the top of this post projected behind us, illustrating deaths occurring due to the disease even as we were making the presentation. We made a pretty good case, and we were off on our own to dive in and make those facts dance their deadly dance in the pages of our own magazine articles.

But having the undisputed king of killers wasn’t enough for me. I was thirsty for more blood. I suppose I wanted more sex in it, too. Based the numbers above, Cardiovascular Disease sounds pretty bad, but how could it be worse than HIV and AIDS? I set out to answer this question by comparing the two based on five critical factors… Read the rest of this entry »

Filed under Content / Architecture, Copy / Writing, Drawing / Illustration, Information / Mapping, Print / Editorial

Comments


Multiple Choice


Multiple Choice, Alternatives to the Worn Out Model of U.S. Transportation booklet; front cover; 4.5 x 4.5in.; 28ppg. / 2003

Teen angst is a powerful force not often harnessed for forward progress. At the same time, many of today’s most overwhelming transportation problems are fueled by inertia. There is one predominantly accepted model that most people of driving age accept as given and therefore perpetuate. If there’s one thing kids hate, it’s being told that they have to do something a certain way. Multiple Choice plays between both of these phenomena.

This book, one of a few projects undertaken for the Publications course in the UW Visual Communication Design program, was designed as a thought leadership piece that might be put out by a major car maker to mark an openness to new ideas, sparking productive discourse on the future of transportation… Read the rest of this entry »

Filed under Content / Architecture, Copy / Writing, Drawing / Illustration, Naming / Words, Photography / Film, Print / Editorial

Comments


American Realities


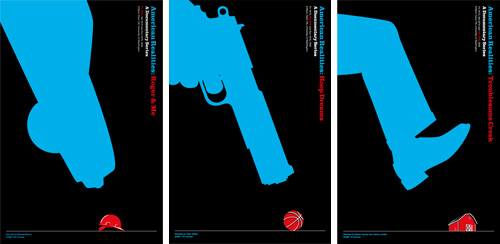
American Realities film series posters: Roger & Me | Hoop Dreams | Troublesome Creek; digital plot outputs; 24 x 36in. (each) / 2002

We Americans are conditioned to think that ours is the best country in the world—that this is the land of opportunity, and we can achieve anything here if we try hard enough. And, by all available evidence, there seem to be plenty of other countries in which people are a hell of a lot worse off than us. But life in the U.S. ain’t all sweet apple pie, and opportunities are easier to come by for some than others. Of course, you’d never know this by watching most film or television. With so much false “reality” pervading contemporary media, it is shockingly refreshing to see the true struggle of real life shown so eloquently in some powerful recent documentary films.

As one of three projects assigned in our Visualizations course in the Visual Communication Design program at the UW, we were to develop a theme around three movies of our choosing for a film festival of sorts, then design a corresponding promotional poster series. With American Realities, I thematically linked Roger & Me, Hoop Dreams and Troublesome Creek, as poignant revelations of Americans forced to work extraordinarily hard just to make ends meet, often against opposing forces of others’ opportunities.

By visually expressing the emotional tension of these stories, I aimed to generate awareness not only of these filmic case studies, but also of the true elusiveness of the American dream… Read the rest of this entry »

Filed under Advertising / Campaigns, Copy / Writing, Drawing / Illustration, Print / Editorial

Comments


The Artful Doodler

There are two types of competition: objective and subjective. Most sports and games are objective: Whoever goes the fastest / gets the farthest / scores the most points / captures the king wins; the rules are well-established, and, generally, blood simple and crystal clear. That’s why athlete interviews are so excruciating to watch: There’s nothing to talk about. They have to resort to a bunch of standardized, time-filling, nonsensical platitudes about how they took the football down the football field (obvious), how their coach, teammates and/or sponsors deserve most or all of the credit (unlikely), or about how they had to give 110% (not possible). Subjective competitions have parameters but no clear qualification for success; success is judged by somebody or a panel of somebodies deemed experts in the field. These make for much more interesting conversation, but the results are always biased and sometimes downright arbitrary.

In terms of competition, it doesn’t get more subjective than a juried art show. It also doesn’t get much more incomprehensible. The primary point of bother is that nobody can even agree on what art is. A lot of people confuse the medium with the message. Just because something is painted doesn’t make it art. Great art reveals before-unrecognized issues; the medium is just a way of delivering the message. To be clear, I also don’t believe design is art, and this is not to say that it is any more or less important. Design’s role is to reconcile the issues revealed by art with pragmatic needs of society.

So, how do you judge art? Assuming you can get beyond the initial hurdle of understanding what art is, it only becomes less simple, because great art breaks rules and redefines those pesky parameters. How can you say whether it has broken the rules and redefined parameters sufficiently? And how does someone become a recognized expert at determining that?

I’ve entered a few design contests (and been entered into many more by firms I’ve worked for), which have their own issues (design can rarely be judged objectively in common show formats because they never allow for enough context to be known). However, I’ve only ever entered one juried art show, and that was in high school. I submitted three pieces… Read the rest of this entry »

Filed under Drawing / Illustration

Comments


Strike One, You’re Out!

Wickman

This man is a professional athlete.

Let me just say this right off the bat (so to speak): I don’t much like baseball. I find it boring. For a professional sport, there are a disproportionate number of noticeably overweight players, and it’s not surprising why: it’s clearly not very challenging in terms of cardiovascular fitness requirements. In case you aren’t familiar with the game, here’s a snapshot of a typical play (one man on first, one on deck):

The batter walks casually to the plate.
The catcher and the umpire crouch down.
The batter takes a few very slow, deliberate practice swings, seemingly showing the pitcher exactly where he wants the ball to be thrown.
The catcher makes some hand signals in his crotch.
The pitcher watches these signals and very subtly shakes his head several times.
The catcher makes more hand signals in his crotch.
The pitcher very subtly nods his head.
The pitcher starts his windup.
The pitcher turns to his left and tosses the ball ever so gently to the first-baseman as the base-runner, who had been about six steps away from said base returns to his position actually on the base before the ball gets there.
The first baseman tosses the ball back to the pitcher.
The base runner resumes the exact same position six steps away from first base.
The pitcher returns his attention to the catcher.
The catcher makes more crotch signals.
The pitcher again refuses the vast majority of these signals, but finally lowers his head to confirm his intent to actually… pitch.
The pitcher winds up and throws the ball to the batter.
The batter does nothing.

This is an actual play! How can people watch this?!!

Depending on if and how the batter hits the ball during the rest of his “at-bat,” this basic process can literally go on forever (there is no limit to the number of mis-hits, or “balls,” allotted to the hitter). Multiply this play by whatever number you want (there is also no limit on how many runs can be scored in an inning) and then multiply that by at least nine innings – per team (but there is no limit on those, either, so if the game is tied, it can go 12 or 13 innings, easy).

However loooong the game ends up being, there are really only two or three players out of at least 10 on the field that are ever doing any kind of activity at the same time, and it’s very brief when it happens. The rest of them are just standing around. If the guy who hits the ball isn’t very good at running, it’s no problem; they just get a “pinch” runner to run for him. If the pitcher gets tired or starts pitching badly, they just bring in another one (no limit on those, either). And almost every position on the field has a specific “coach” in the game to consult on what a player should do there, so strategic thinking isn’t a necessary skill, either.

Let’s just get to the point: This has got to be the laziest sport in the world. How did this become our national pastime? Have any of these national pastime people ever seen a game of basketball? Or table tennis? Pac-Man? Anything?

Luckily, I once had an opportunity to turn my frustration for Major League Baseball into one of my favorite design projects… Read the rest of this entry »

Filed under Drawing / Illustration, Print / Editorial

Comments (4)